
I wrote a post on embedded trends in 2017: 2017 Embedded Markets Study. This was based on the study of the same name, made every second year by the magazines “EE Times” and “embedded”. Now I look at the newer study from 2019 (from hereon “the study”), and compare it with my own experiences – written in italics. It is interesting how stable the trends actually are.
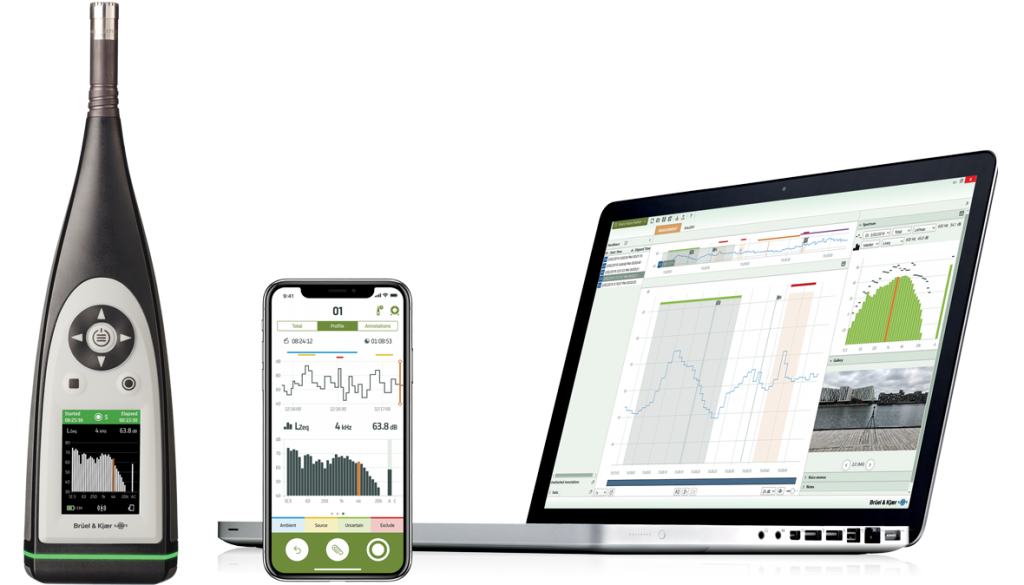
As I work in a private company – competing on the open market – I can only relate to released products. The latest one is a Sound-Level Meter type 2245. Here it will be referred to as “SLM”. Below is a picture of the SLM, together with the apps that comes with it.
The survey uses the terms “EMEA” for Europe + the Middle East + Africa, “APAC” for Asia + Pacific and “Americas” for US + Canada + Central- and South-America. All results are in percentages. Sometimes it’s clear when these must add up to ~100, and when respondents were allowed to select several answers.
People & Teams
When you watch the news, it’s like all developers basically are fresh out of university, but when I look around in my department (and in the mirror), I see a lot of grey hair. According to the study, the average years “out of school” is 26. If we only include “high-school” in the definition of school, this means that the average embedded developer is app. 44 years old. If we include university he/she is 50!
The average number of employees in the participating companies has been very stable over the last six years – between 3400 and 3900. Nevertheless, 48% are employed in a company with less than 100 people. Thus, there is a big spread in company sizes, and the average is held up by the ~10% of the companies with more than 20000 people.
The embedded development team is in average from 14 people in EMEA, over 15 in the Americas, to 20 in APAC. Typical development projects take from 10 to 13 months – with the ones in APAC being the fastest.
In average, 60% of a team are considered SW-developers, while 40% are seen as HW-developers – within 1% as in 2017.
When people in the study are asked about future challenges, the top-3 response is:
- 20% – Integration of new technology
- 16% – Managing code size/complexity
- 15% – Security concerns
Back in 2017 the top-3 was the same, albeit in another order.
In average people work on 2.1 projects at the same time. In 2014 this was 2.0.
Skills
The skills of the team must match the capabilities of the product. These are the capabilities mentioned:
- 54% – Real-time
- 51% – Digital Signal Processing
- 49% – Networking capability
- 46% – Analog signal processing
- 42% – Wireless capability
- 34% – Battery Powered
- 31% – Rugged Design
- 26% – GUI
- 15% – AI/Machine learning
- 9% – GPU
The above list looks pretty much like it did in 2017. The “Battery Powered” is new – an so are the bottom two.
Apart from the bottom two, we needed them all in the SLM. Analog and digital signal processing is at the heart of anything we do, and we are pretty good at networks. This was however, the first time we integrated Wireless in the core-product. Rugged design and battery is not new to us – but it is always a lot of work. And then more work. Even though Linux does not favor real-time, the CPU can buffer data from A/D and to D/A – controlled by a stable oscillator. On top of this we implemented a complex time-keeping system, with GPS, NTP and a HW-clock. There is no USB capability on the list. Being a front-runner on USB-C was no small feat.
Applications
I have a problem with the application domains in the study. Since 2017 “Communications/Wireless/Networking” has gone down, while IoT has gone up. But once you are in embedded – what’s the difference? And is the automation of a car plant automotive or automation. It is easy to get confused. Similarly when IoT is expanded. When does a respondent check-mark “Sensor-Driven” instead of “Industrial” or “Smart building”? Don’t we involve sensors in both of the latter cases? The problem is that IoT is everywhere!
Anyway, let’s take a look at the high runners:
- Industrial control. Fluctuating over the years. At 32% now – but at 41% in EMEA!
- Consumer electronics. At 29% – up from 21% in 2015 – but at 40% in APAC!
- IT and Communications/Wireless/Networking is at 25%.
- Communications/Wireless/Networking is at 19%.
Most likely, the German automotive market is driving the Industrial Control, while the Chinese, Japanese and South-Korean industry is driving the consumer market. The consumer market is also where the largest change has taken place. You might expect that even though a lot of consumer electronics is produced in Asia, the development would take place in the US. But there is a lot of Asian gadgets that we do not even see in the West.
OS and CPU
The OS and the CPU is like Yin & Yang – a “cosmic duality set of two complementing and opposing cosmic energies” 🙂 You cannot really speak of one, without discussing the other. These days Linux is the most popular OS. In the study, “Embedded Linux” accounts for 21% of all projects, but there is also Ubuntu (14%), Debian (13%) and Android (13%). FreeRTOS is 18%.
This popularity is largely due to open-source – the code is available, and there is a large community to seek help from. But that’s not the full story. Linux supports SMP – Symmetrical Multi-Processing. This means that many cores in a CPU have equal access to resources – like RAM and I/O. This was completed with version 2.6 of the Linux kernel, that on top of the equal access implements an “affinity”. This means that yes – any core can resume the work of a previous core, but there is a system to keep this core-switching down. The advantage is that caches rarely need to be flushed. This boosts performance. Many smaller kernels and homegrown systems do not include SMP.
Meanwhile we saw Moore’s law fading out. We used to double the speed of a CPU-core every 18 months, but clock-frequencies became so high that physics became problematic. The solution is more cores in the same CPU. With Linux, you normally don’t have to think about which core does what. Writing code that is safe for concurrent access is more important than ever, but we have processes and compilers for that.
A third of all designs are created without any OS or kernel. This share is very stable. I assume that these designs have a limited functionality. If you need to do the same over and over – fast or slow doesn’t matter that much – then you can program something very simple.
As Linux and its siblings are gaining market share, the commercial OS’es are losing it. The most quoted reason to use a commercial OS, is real-time capability. FreeRTOS might be a good alternative.
57% of all projects use a single CPU (one to many cores). In EMEA however, single CPU projects accounts for 65% of all designs. This may be linked to the fact that Embedded Linux is especially popular in EMEA with 30% – compared to the average of 21% described earlier.
The average number of CPUs in a project is 2.2 – down from 2.4 in 2013. It is a lot easier to implement a single CPU with many cores and let Linux deal with the arbitration, than it is to have multiple, physical CPUs.
In the study, 15% is on 64-bit, 61% are using a 32-bit CPU, and 10% are on each of 16-bit and 8-bit. The rest doesn’t know – which means they work at a high abstraction layer.
In previous SLMs we have had a generic single-core CPU and a dedicated DSP. The new SLM uses a modern 32-bit, multi-core ARM CPU with Linux, and we could do without a dedicated DSP.
Programming Languages
The embedded world is extremely static when it comes to the choice of programming language. C is a clear winner with 56% of projects, with C++ on 23%. C# has gone from 2% to 1% since 2017, while Java stays on 2%. Only real change is Python that has grown from 3% to 6% since 2017.
In the SLM we use C and a little C++. We also used C in its predecessors. We like to use Python for testing.
Circuit Boards
The study shows a small growth in the use of OTS – Off-The-Shelf – boards. In 2017, 19% of all designs used OTS, while in 2019 the number was 23%. The rest is own design or subcontracted.
When it comes to the actual format, 26% is custom and 18% is proprietary. I don’t understand the difference between these two. The next on the list is Arduino with 17% and Raspberry Pie with 16%. I think that many developers originally used Arduino and Raspberry Pie as cheap Linux development boards. They were not of industrial quality and thus not viable in a real product, but now you can buy derivatives that are. If you can base a product on one of these boards you can get far with little. On the other hand: without your own HW you may find yourself in a “red sea”. This is a place where it’s easy for competitors to move in.
A sound-level meter must have the bottle-shape seen in the picture, in order to disturb the sound-field as little as possible. We also want it compact, and end with a requirement to make our own special-shaped boards.
FPGA
Many respondents in the study say that FPGA is too complex, power-hungry or simply unneeded. Still, it seems that since 2013 a third of all projects keep using FPGAs. With 58%, Xilinx is the preferred current vendor – with Altera/Intel on 50%. When asked about future designs, Xilinx becomes even more popular – with 70% vs 59% for Altera. In smaller R&D departments it can be a challenge to have enough FPGA-developers to get past critical mass, and still have enough work to feed them. This might force the architects into some strange choices – or open up for dedicated FPGA consultants.
In the SLM we did not need an FPGA. However, we do have faster, non-battery-driven, products that do use FPGA.
Security
The general top-scores on the security list is:
- 45% Encyption (49% in EMEA)
- 41% Authentication
- 27% Secure Boot
- 22% Secure OTA (Over The Air) update
31% are using MCU security features, which can be built in HW-encryption, a full TPM-module or write-only key-storage (12% on its own). It seems that the availability of TPM and similar building blocks inside the CPU we are buying anyway is a good motivator.
In the SLM we use Encryption and Authentication. This is driven from employees as well as from customers. IOS has also had a great influence. When you need to connect your IOS Safari browser to a webserver in a device with http, IOS warns you. But if you want your app on IOS to silently contact your device webserver for a REST-call, IOS demands the use of https – and hence certificates. The GDPR – General Data Protection Regulation – in the EU might be the reason why EMEA is in front on encryption.
Development Process
- The development process numbers for time spent in the various phases are all within 1% of their 2017 version and within 2% of the 2015 version. The 2019 version:
- 13% – System Specs
- 11% – Conceptual design
- 4% – Security/risk assessment (new)
- 31% – Detailed design
- 6% – Simulation
- 19% – Test & Debug
- 9% – Prototyping
- 6% – Transition to production
The above numbers are, as stated, almost unchanged over time. However, the same goes for the overall process, which here is “Waterfall”. A search in the study for “scrum” or “agile” gives 0 hits. I hope that the 2021-version will spend some time and space on waterfall vs agile.
When it comes to project management, the major tool is still Excel – used by 42%, with MS Project on 32% and Visio (!) on 21%. This also spells Waterfall.
In all projects I have ever participated, the phases have overlapped. We worked on the detailed design of something, a prototype of something else, and simulated the third. Meanwhile a requirement changed.Thus, I have never worked completely by the Waterfall paradigm – just as I am sure I will never work 100% agile.
Tools
It would be a pity to squeeze in a small paragraph on tools here. This will be a page on its own.